When you run or debug a Decision Model and Notation (DMN) model, the Event Viewer provides detailed execution logs. This same level of transparency extends to DMN services deployed as Google Cloud Functions.
Once your DMN model is deployed as a Google Cloud Function, you can retrieve comprehensive execution logs by enabling Full Log in Service Calls.

Capture the Execution Log Response
Once you get the service response, including the conclusion log , you can copy all the response body and save it as a JSON file. Then, you can load this JSON file into the Event Viewer in FlexRule Designer to analyze the full conclusion log.
Analyzing Execution Log in FlexRule Designer Event Viewer
Then, you can navigate to FlexRule Designer and click on the Event Viewer in the Tools section of the menu bar.
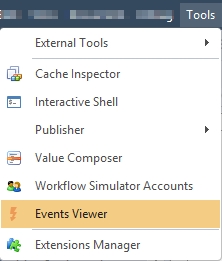
Then you can click on “Open events JSON File” to load the JSON file you created before.

At this time, you can see the detailed analysis of the execution log via Event Viewer in the FlexRule Designer.

Summary
This article explains how to obtain and analyze execution logs for a DMN service deployed as a Google Cloud Function. After deploying your DMN model as a Google Cloud Function, you can enable full logging in the service calls to capture comprehensive execution details, including the conclusion log. The response body, which contains the conclusion log, can be copied and saved as a JSON file. This file can then be loaded into the Event Viewer within FlexRule Designer. It allows you to visually inspect and analyze the step-by-step execution of your DMN model for debugging and transparency purposes.